On Thursday 2 May 2019 elections were held in England and over 8,300 seats up for grabs. These were local elections, but with Brexit in the background and the parliamentary arithmetic in continuing to work against the government, it was always inevitable that they would be viewed in the light of national politics, rather than a local contest. The coverage of Thursday’s election results which almost exclusively sought to analyse and interpret the results with reference to Brexit confirmed this.
This is nothing new. Local elections are often perceived to be little more than ‘second order’ contests where voters use an ‘inconsequential’ local ballot to send a message to national politicians, and national factors undoubtedly play some role in the way people vote in local elections.
But drawing national conclusions from local election results is fraught with difficulty and can see the result misrepresented, particularly by the parties involved who will be keen to put a positive gloss on on how they’ve done. One particular frustration of mine is the way politicians and pundits use the number of council seats won or lost compared to previous years as a metric for assessing parties’ performance at a national level. There are several problems with this, and a number of dynamics at play in local elections make attempts to compare results on this basis with previous years fundamentally flawed.
The local electoral cycle
The first is that not all local elections take place at the same time. This is partly down to the ‘model’ used by local authorities to elect their members. Most councils elect their all of their members in one go, while (coincidentally) around a third of councils opt for the ‘thirds’ model. A small number of authorities elect their members in halves.
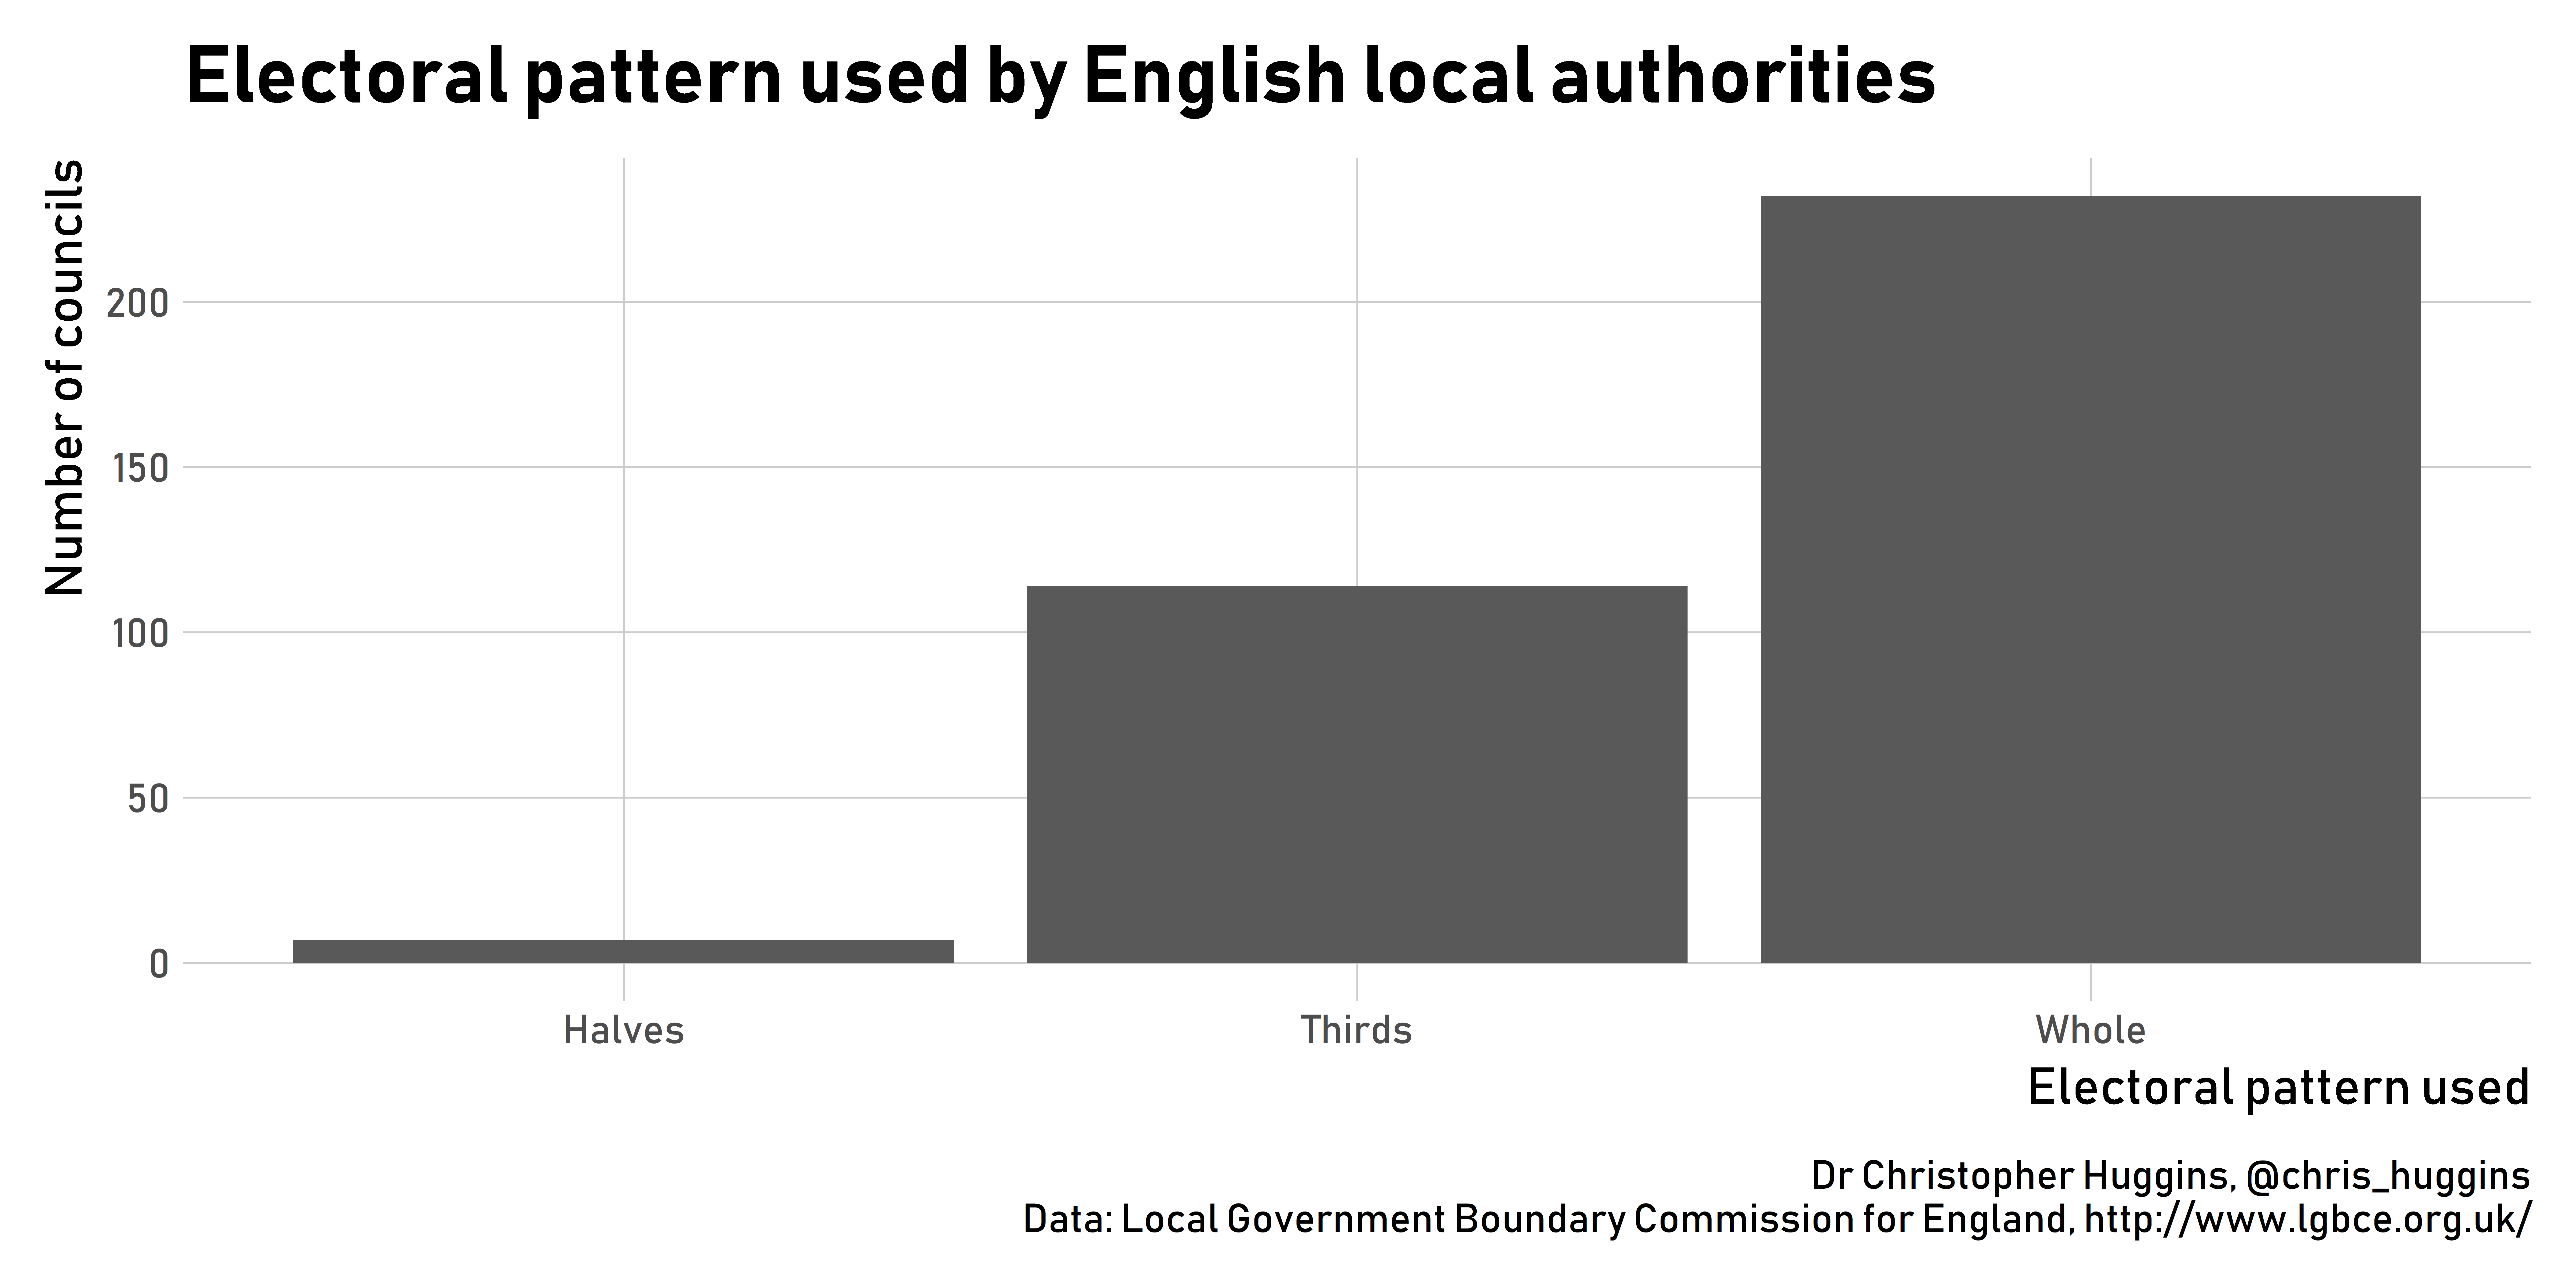
These patterns aren’t necessarily set in stone either. For example, my local council, Norwich City, normally elects its members in thirds. But a recent review saw all but one of the ward boundaries change, meaning the whole council was up for election this year.
This means no two local elections are alike, and, crucially, never cover the whole of England. We can’t compare this year’s local elections with those that took place last year. For example, none of the London boroughs were up for election this year (which caused some embarrassment for Boris Johnson when he was caught out lying about his own electoral behaviour).
In some cases the electoral cycle has been ‘tweaked’. For example district councils in Northamptonshire should have been taking part in Thursday’s vote, but elections were suspended due to ongoing reorganisation following Northamptonshire County Council’s financial issues, and with the Communities Secretary James Brokenshire believing the “Elections in such circumstances risk confusing voters and would involve significant costs that would be hard to justify”.
We also need to bear in mind local elections see a large number of seats go uncontested. This year the Electoral Reform Society estimated 148 seats were decided weeks before the election itself by virtue of there only being one candidate standing, effectively disenfranchising 270,000 people.
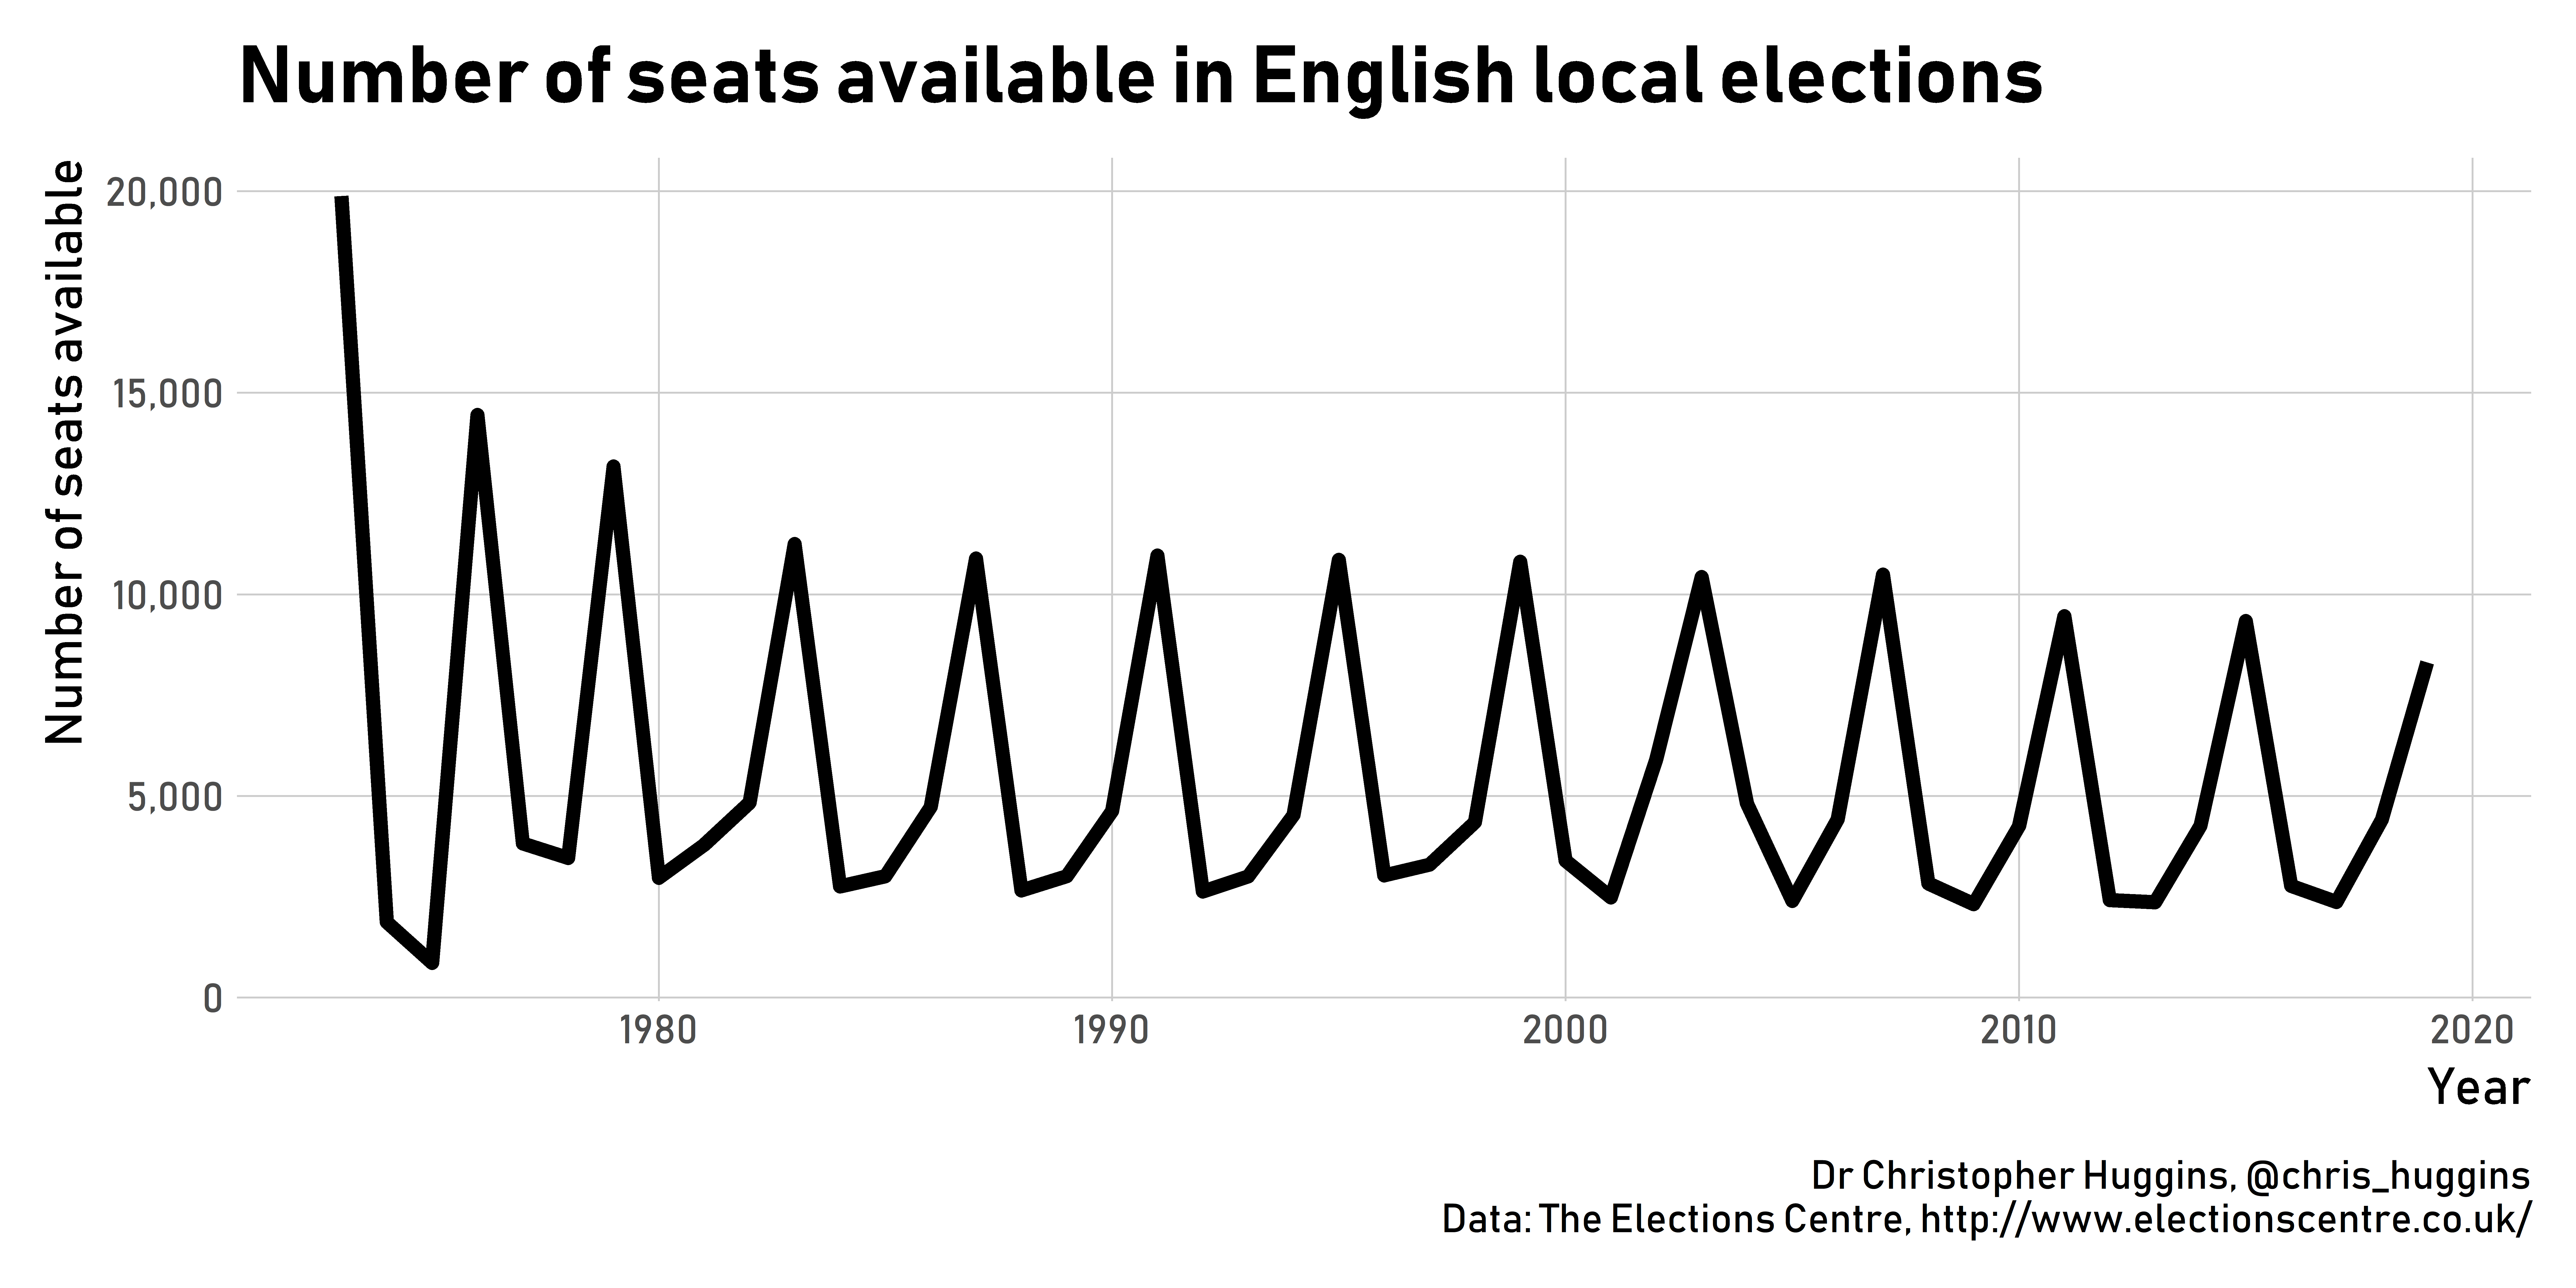
The net result of this is that number of councillors up for election varies each year, making like-for-like comparisons with previous years difficult. While there is a general ‘pattern’ or ‘cycle’, the number of available seats in any two years is not the same and there has been a steady decrease in the number of seats up for grabs each time the electoral cycle comes round.
This, and Northamptonshire’s example in particular, also highlights how local government reorganisation needs to be accounted for.
Local government reorganisation and reduced local representation
English local government’s lack of constitutional protection means the institutional landscape it operates in is in constant state of flux. While one part of this has been the creation of combined authorities with new ‘metro mayors’, another trend has been the steady agglomeration of smaller councils and ‘unitarisation’ of two-tier areas.
This year in Suffolk, for example Suffolk Coastal and Waveney District Councils merged to form the new East Suffolk Council, while Forest Heath and St Edmundsbury District Councils merged to form the new West Suffolk Council. This has affected the number of council seats up for grabs in these areas, resulting in an overall reduction of 27% of councillors across the two new authorities, from 162 to 119.
Even within authorities which are not subject to reorganisation, financial pressures are often used as justification for reducing membership. In 2018, for example, Newcastle-under-Lyme Borough Council cut the number of councillors it had by over a quarter, from 60 to 44.
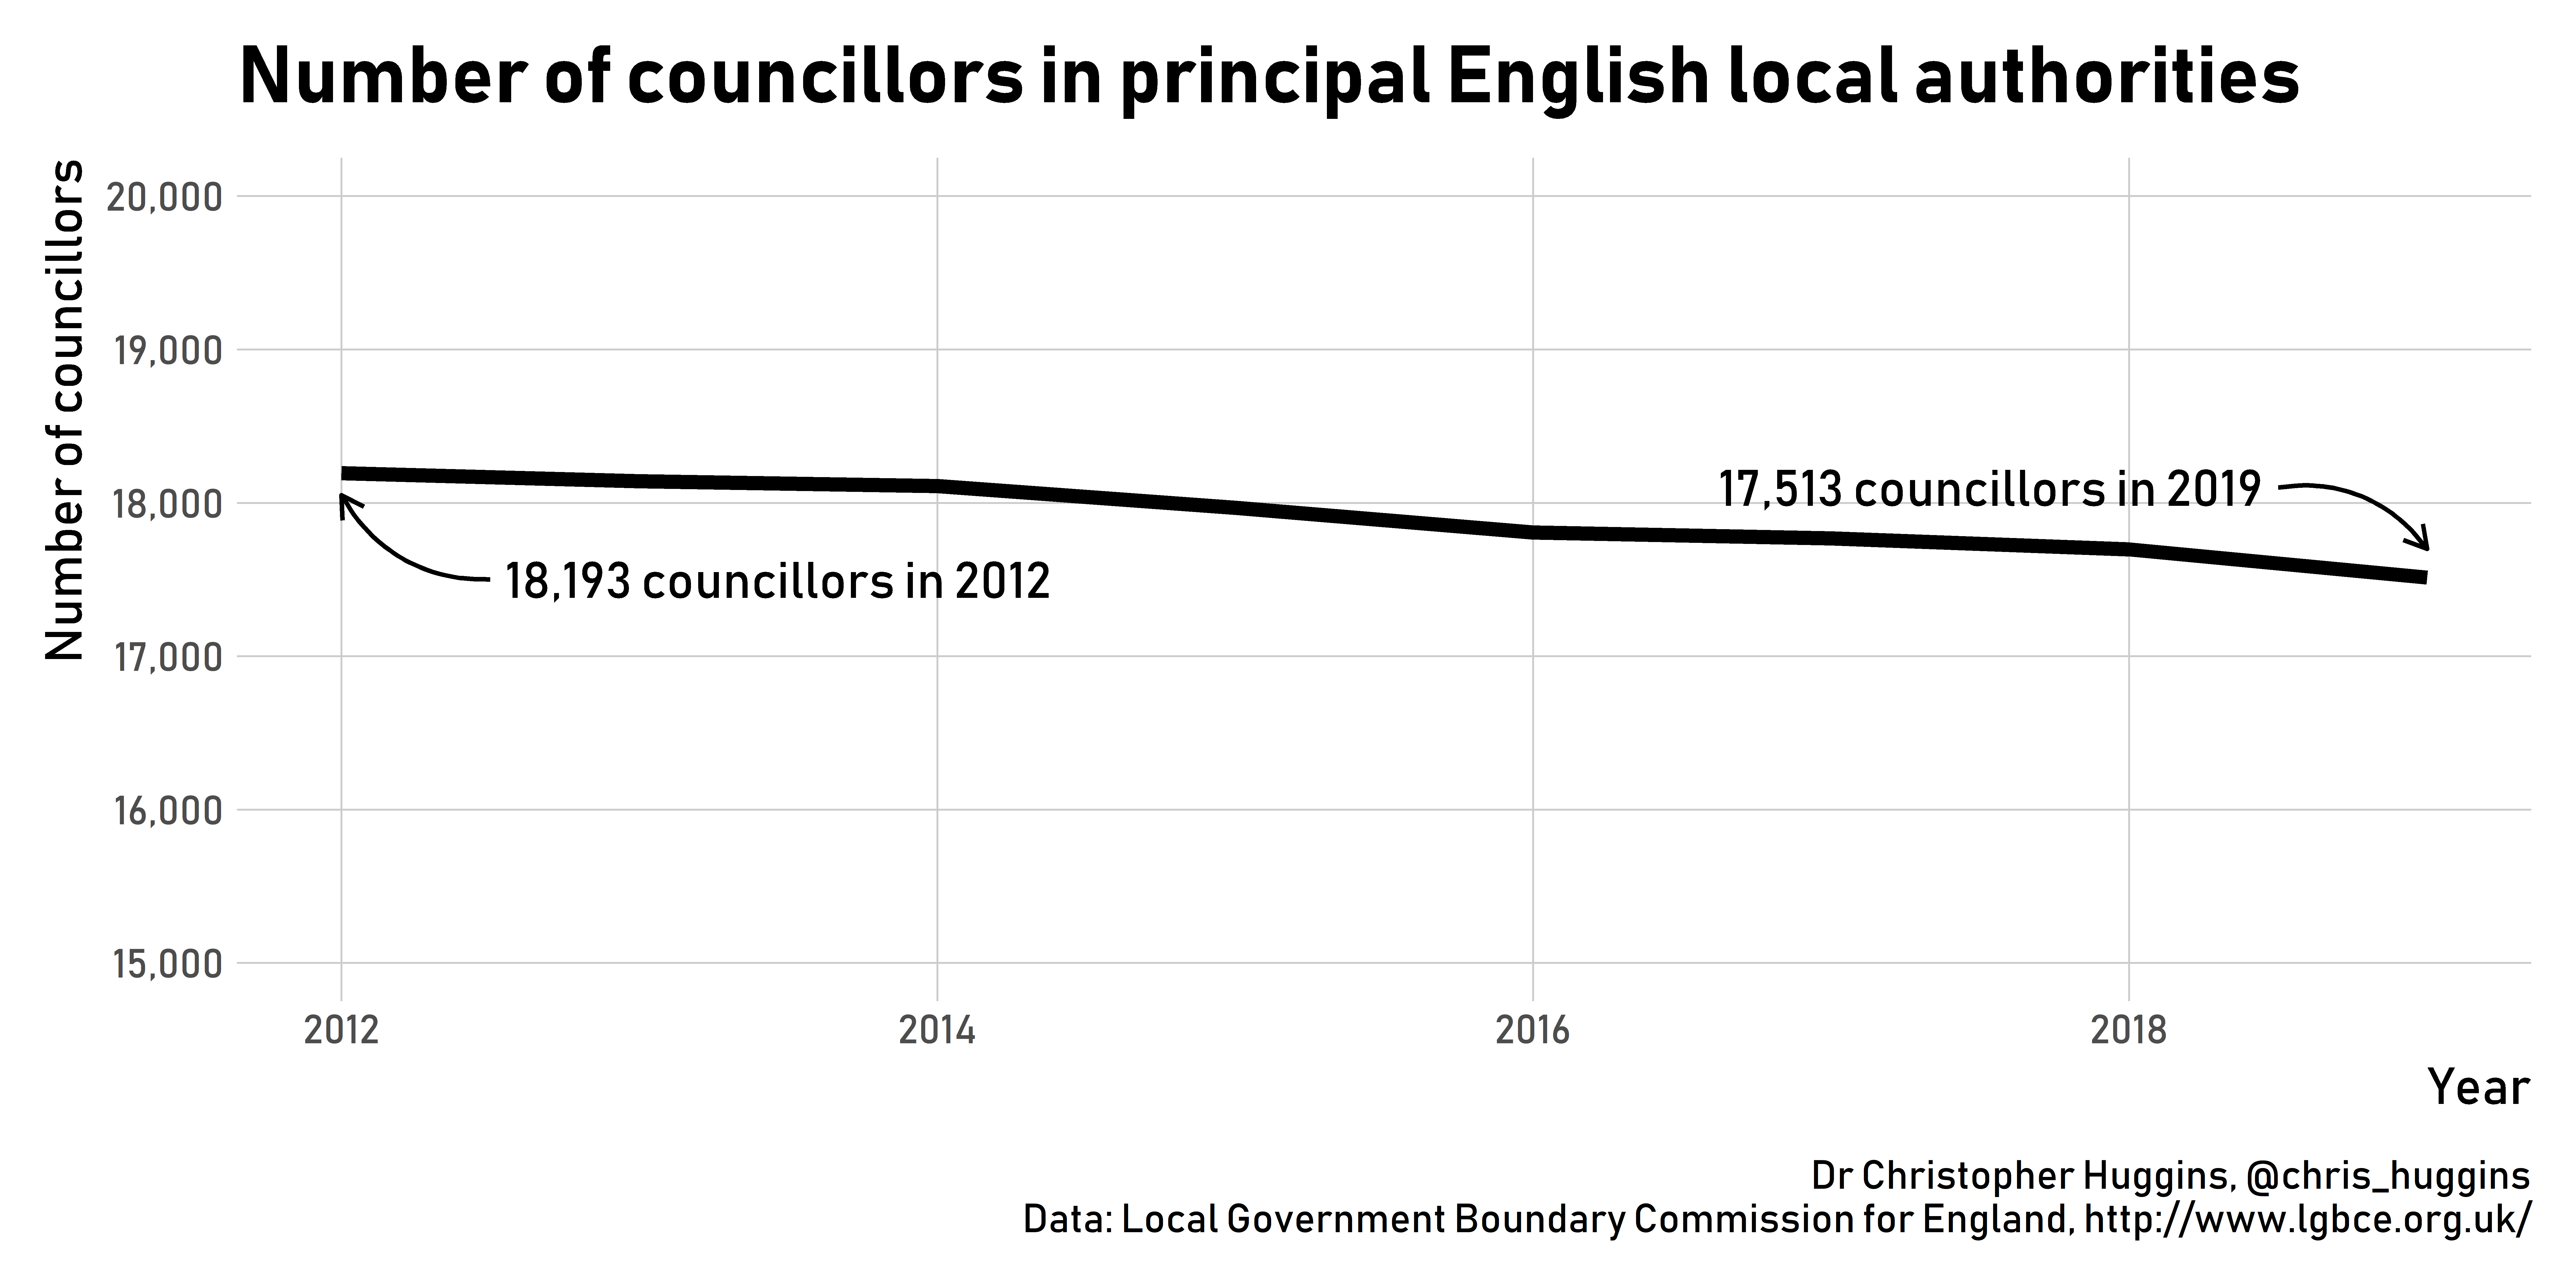
Indeed, across England the number of councillors is falling. In 2012 there were 18,193 councillors, but this had fallen to 17,513 in 2019, and is likely to be lower still given recent reorganisations.
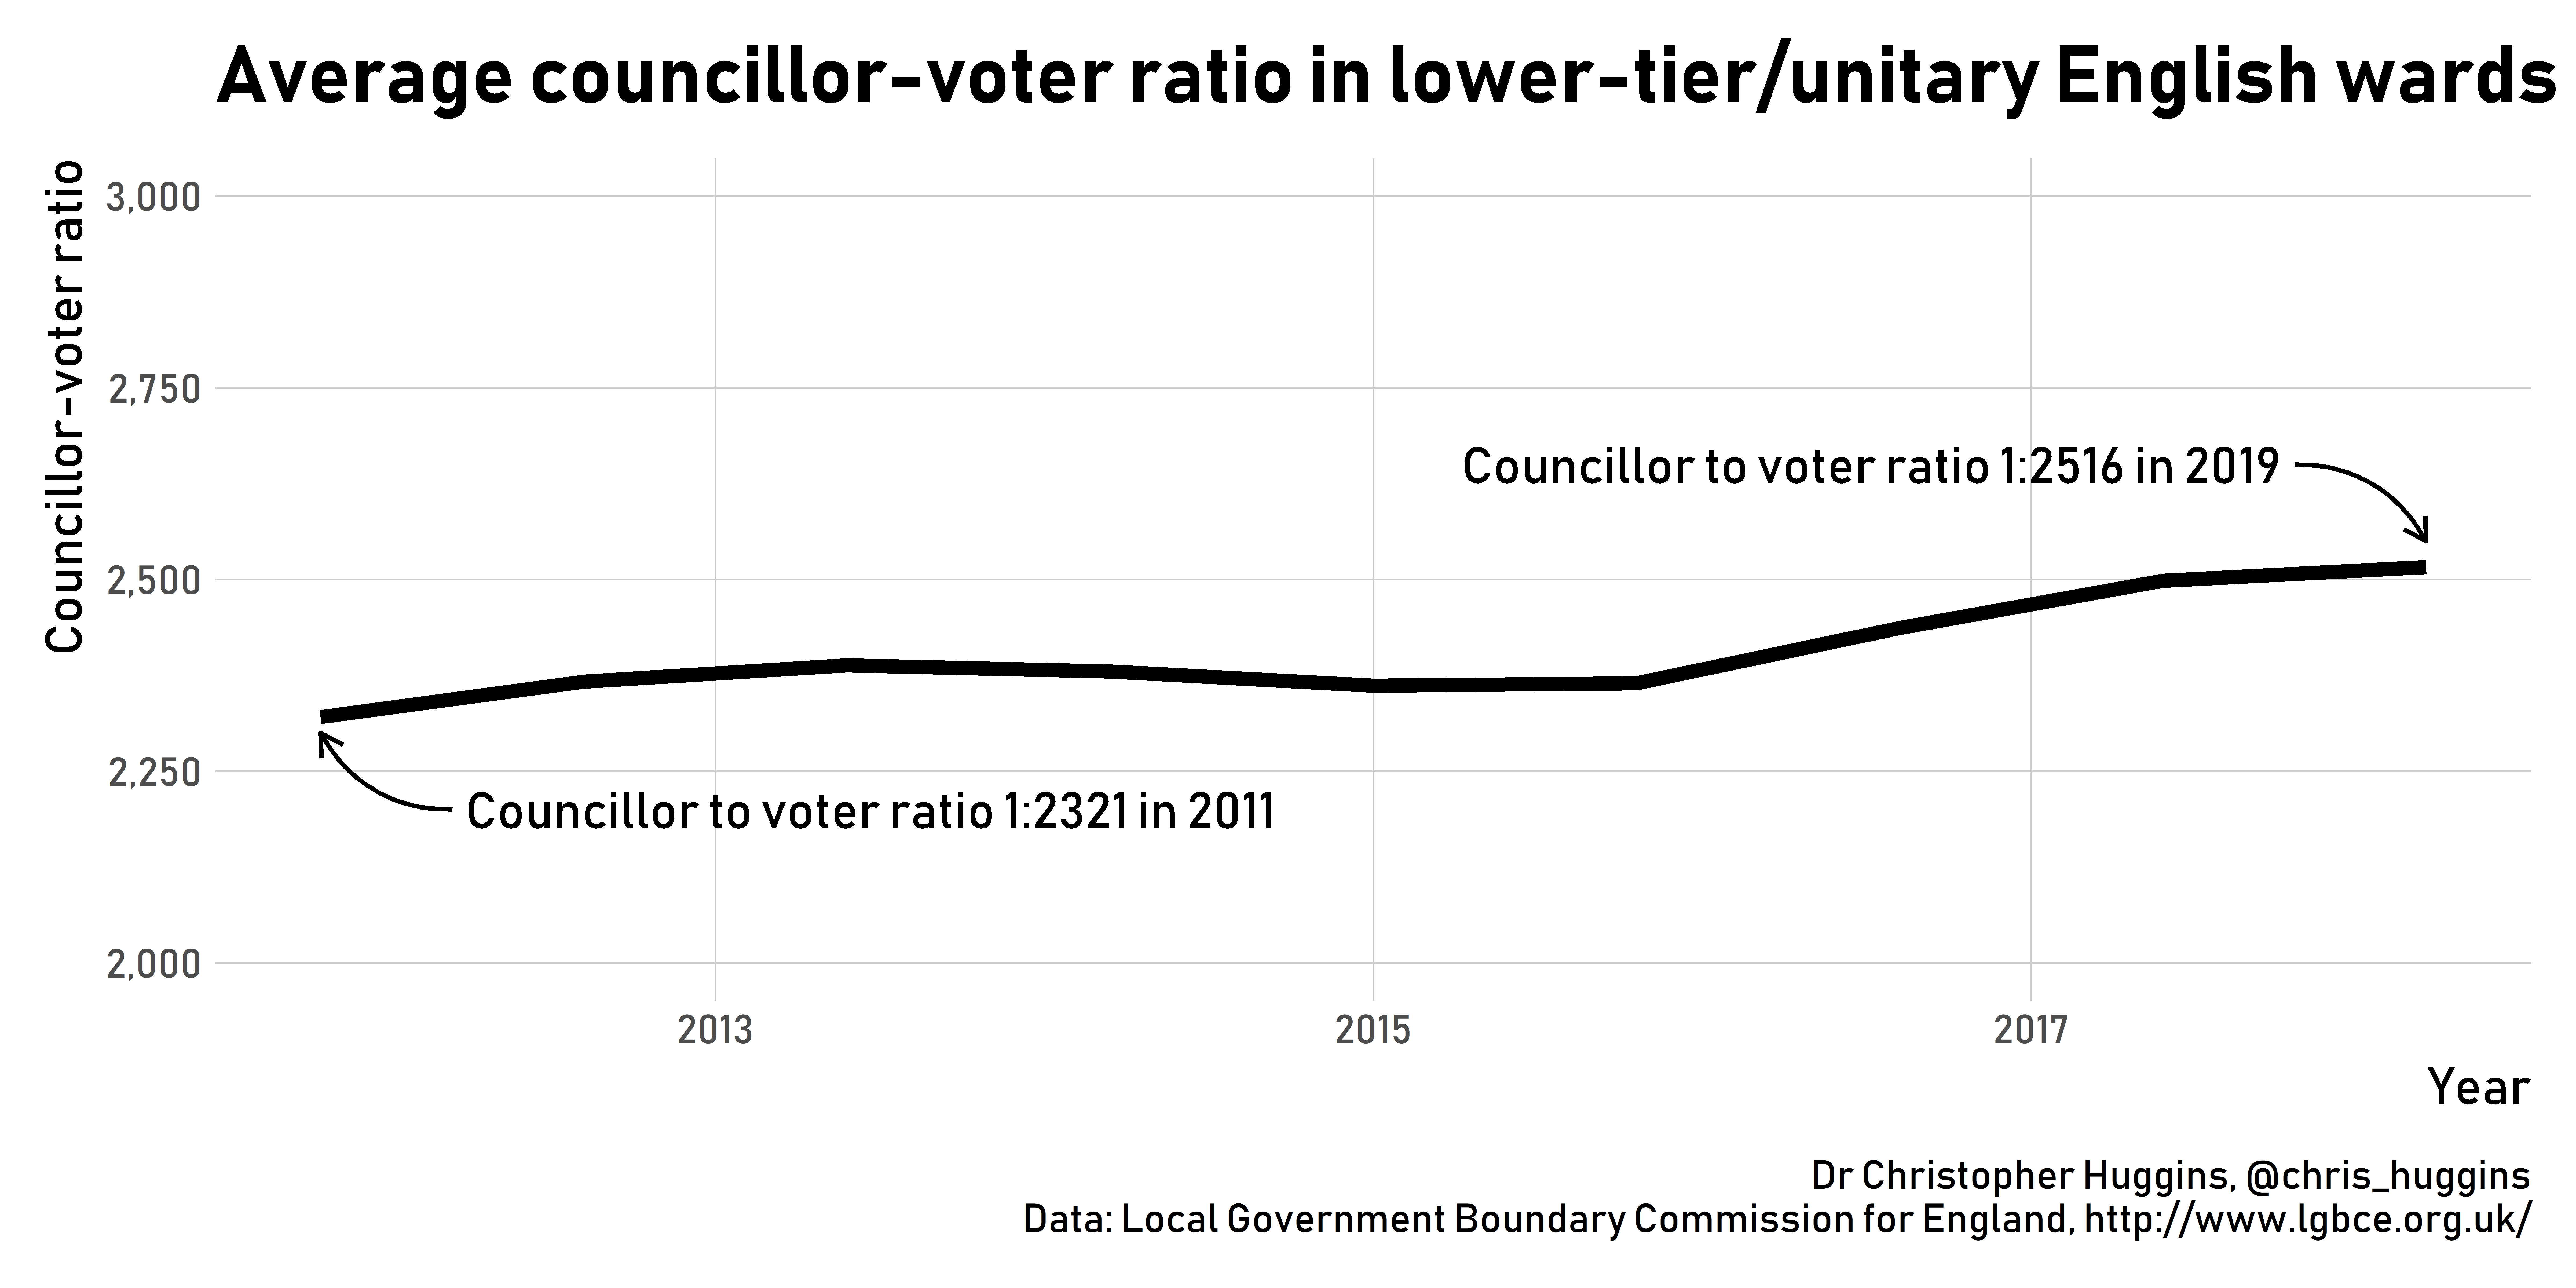
This is having an impact on local representation as the average number of voters represented by each councillor is increasing. Among lower-tier and unitary councils, councillors now represent on average 2,516 voters, compared to 2,321 voters in 2011.
From a local democracy perspective, this trend is worrying, not least because there is little public discussion about these changes. But it also has an impact on our ability to compare local election results over time. In this context, any notional losses made by parties expressed as raw numbers of seats are likely to be exaggerated, given there are ever fewer seats available each time the electoral cycle comes round. Even if everyone voted the same way they did last time, it was inevitable many incumbent councillors would lose their seats by default.
Trying to draw national conclusions
All of this means looking at the raw number of seats won and lost as a proxy to assess party performance in local elections is inherently flawed. This is why measures such as the BBC’s projected national share, or Rallings and Thrasher’s national equivalent vote are useful, because they try to account for variations in the cycle of local elections and project what the result would’ve been had everywhere been voting.
For example, an eyeball of the seats won or lost by each of the main parties last week might lead us to suggest the Conservatives had a much worse night than Labour. In fact both the BBC’s and Rallings and Thrasher’s estimates had both parties tied when extrapolated to the national level.
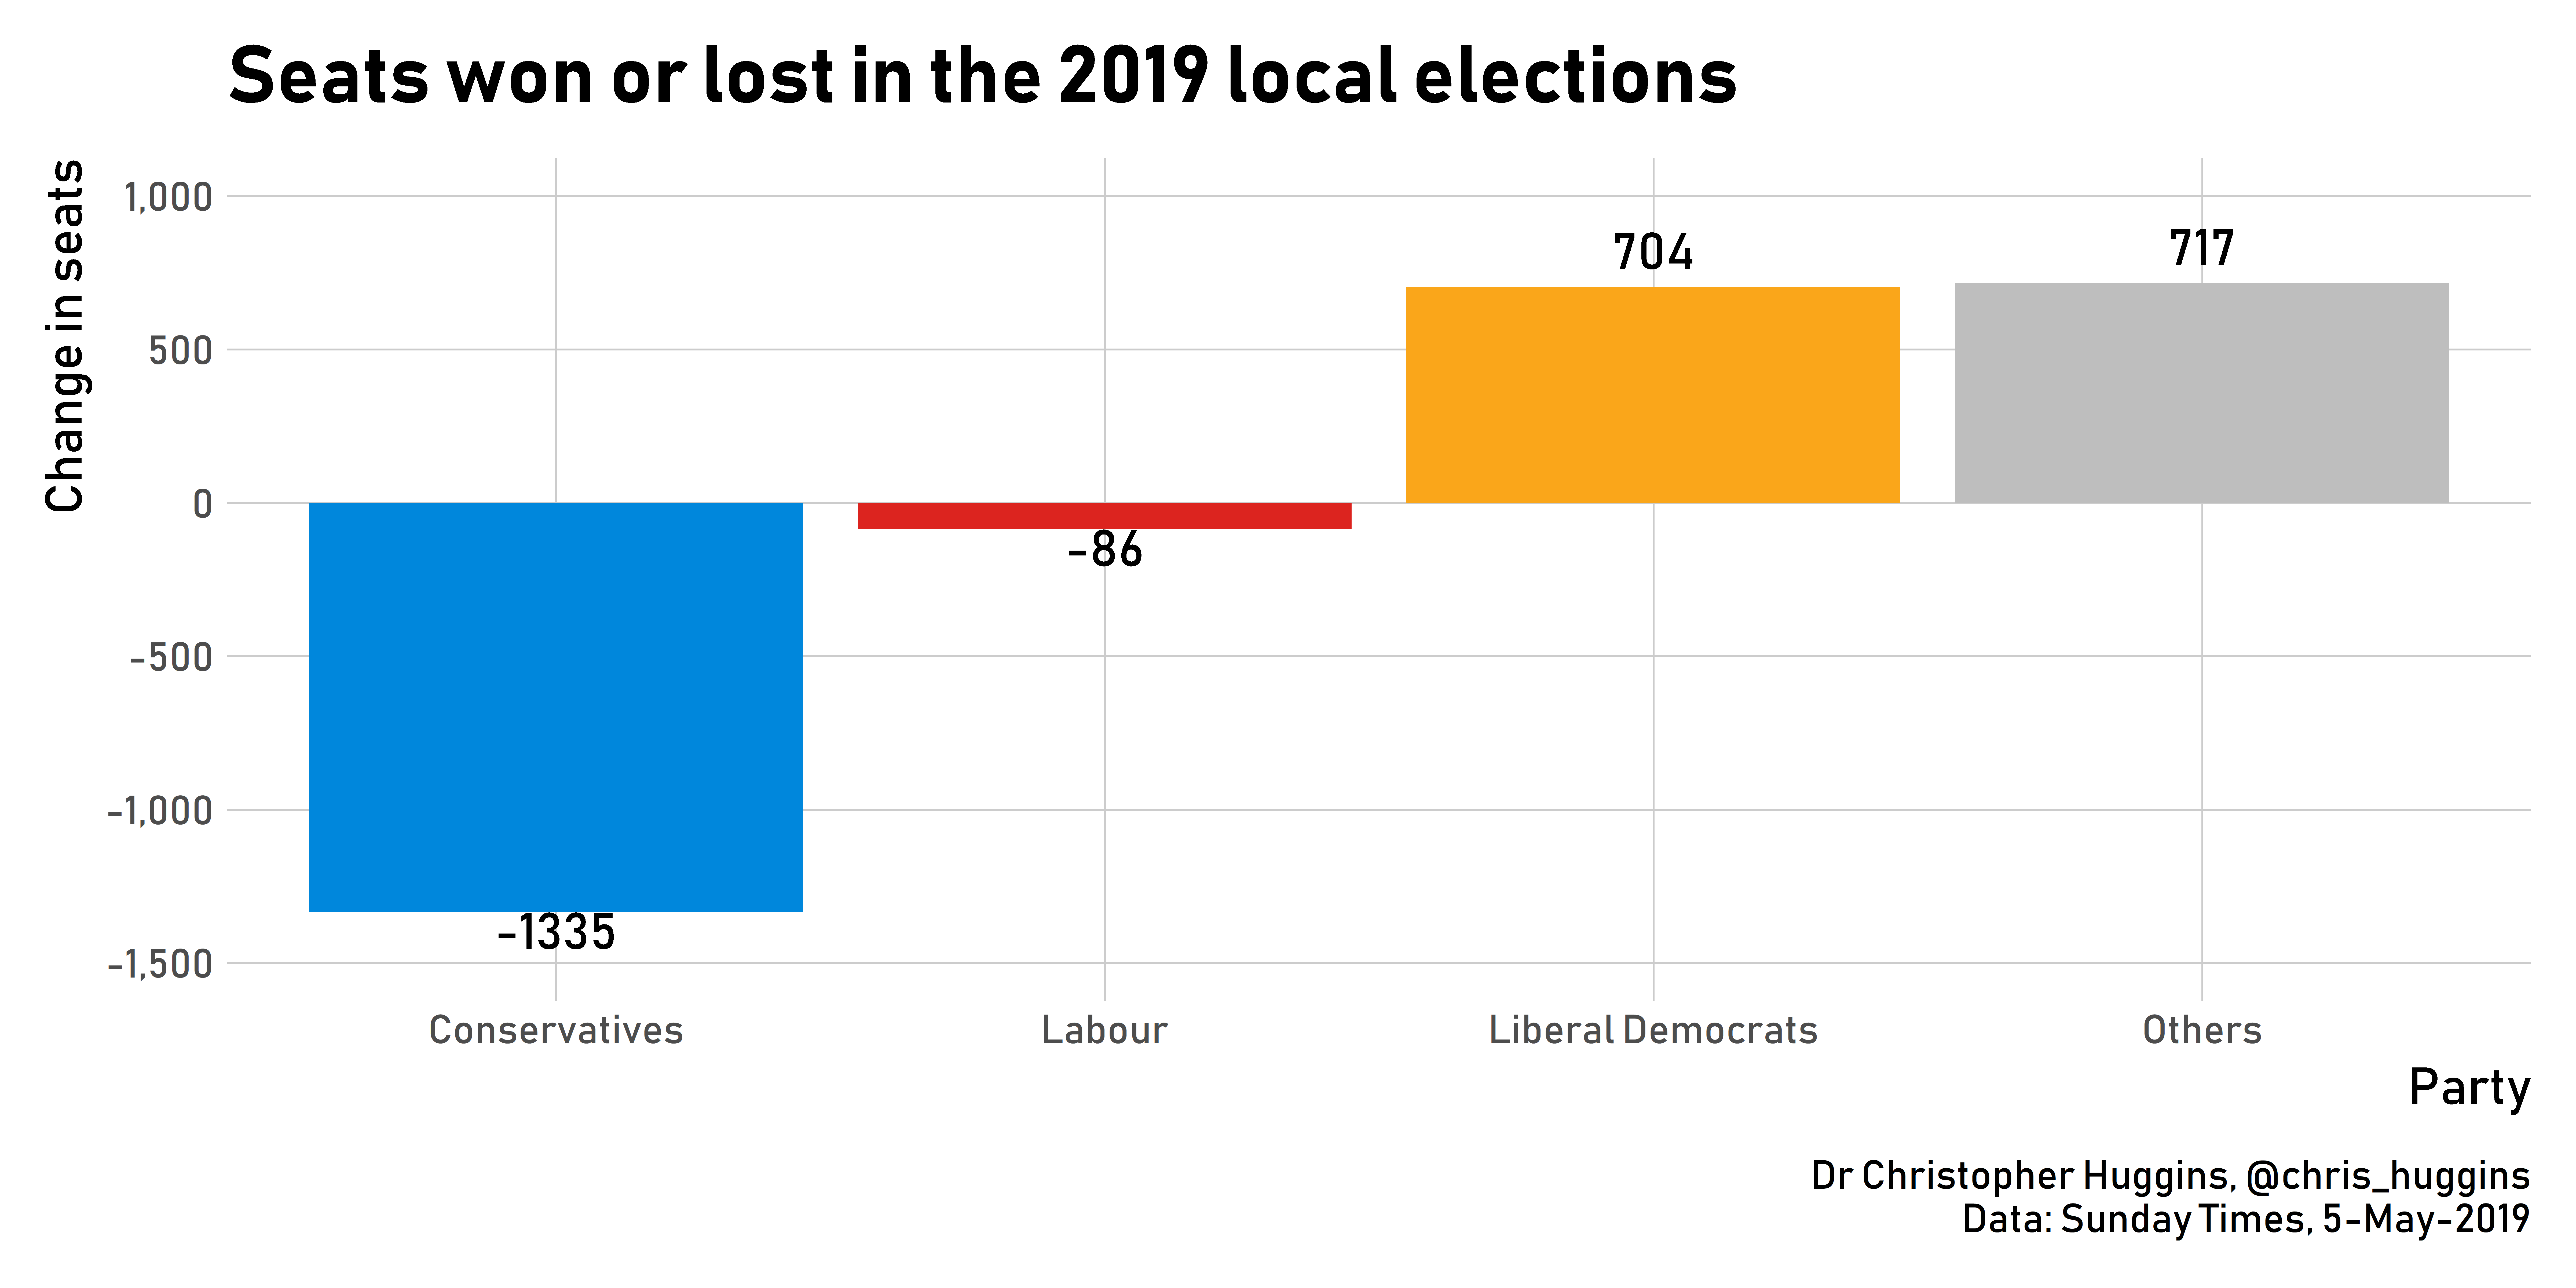
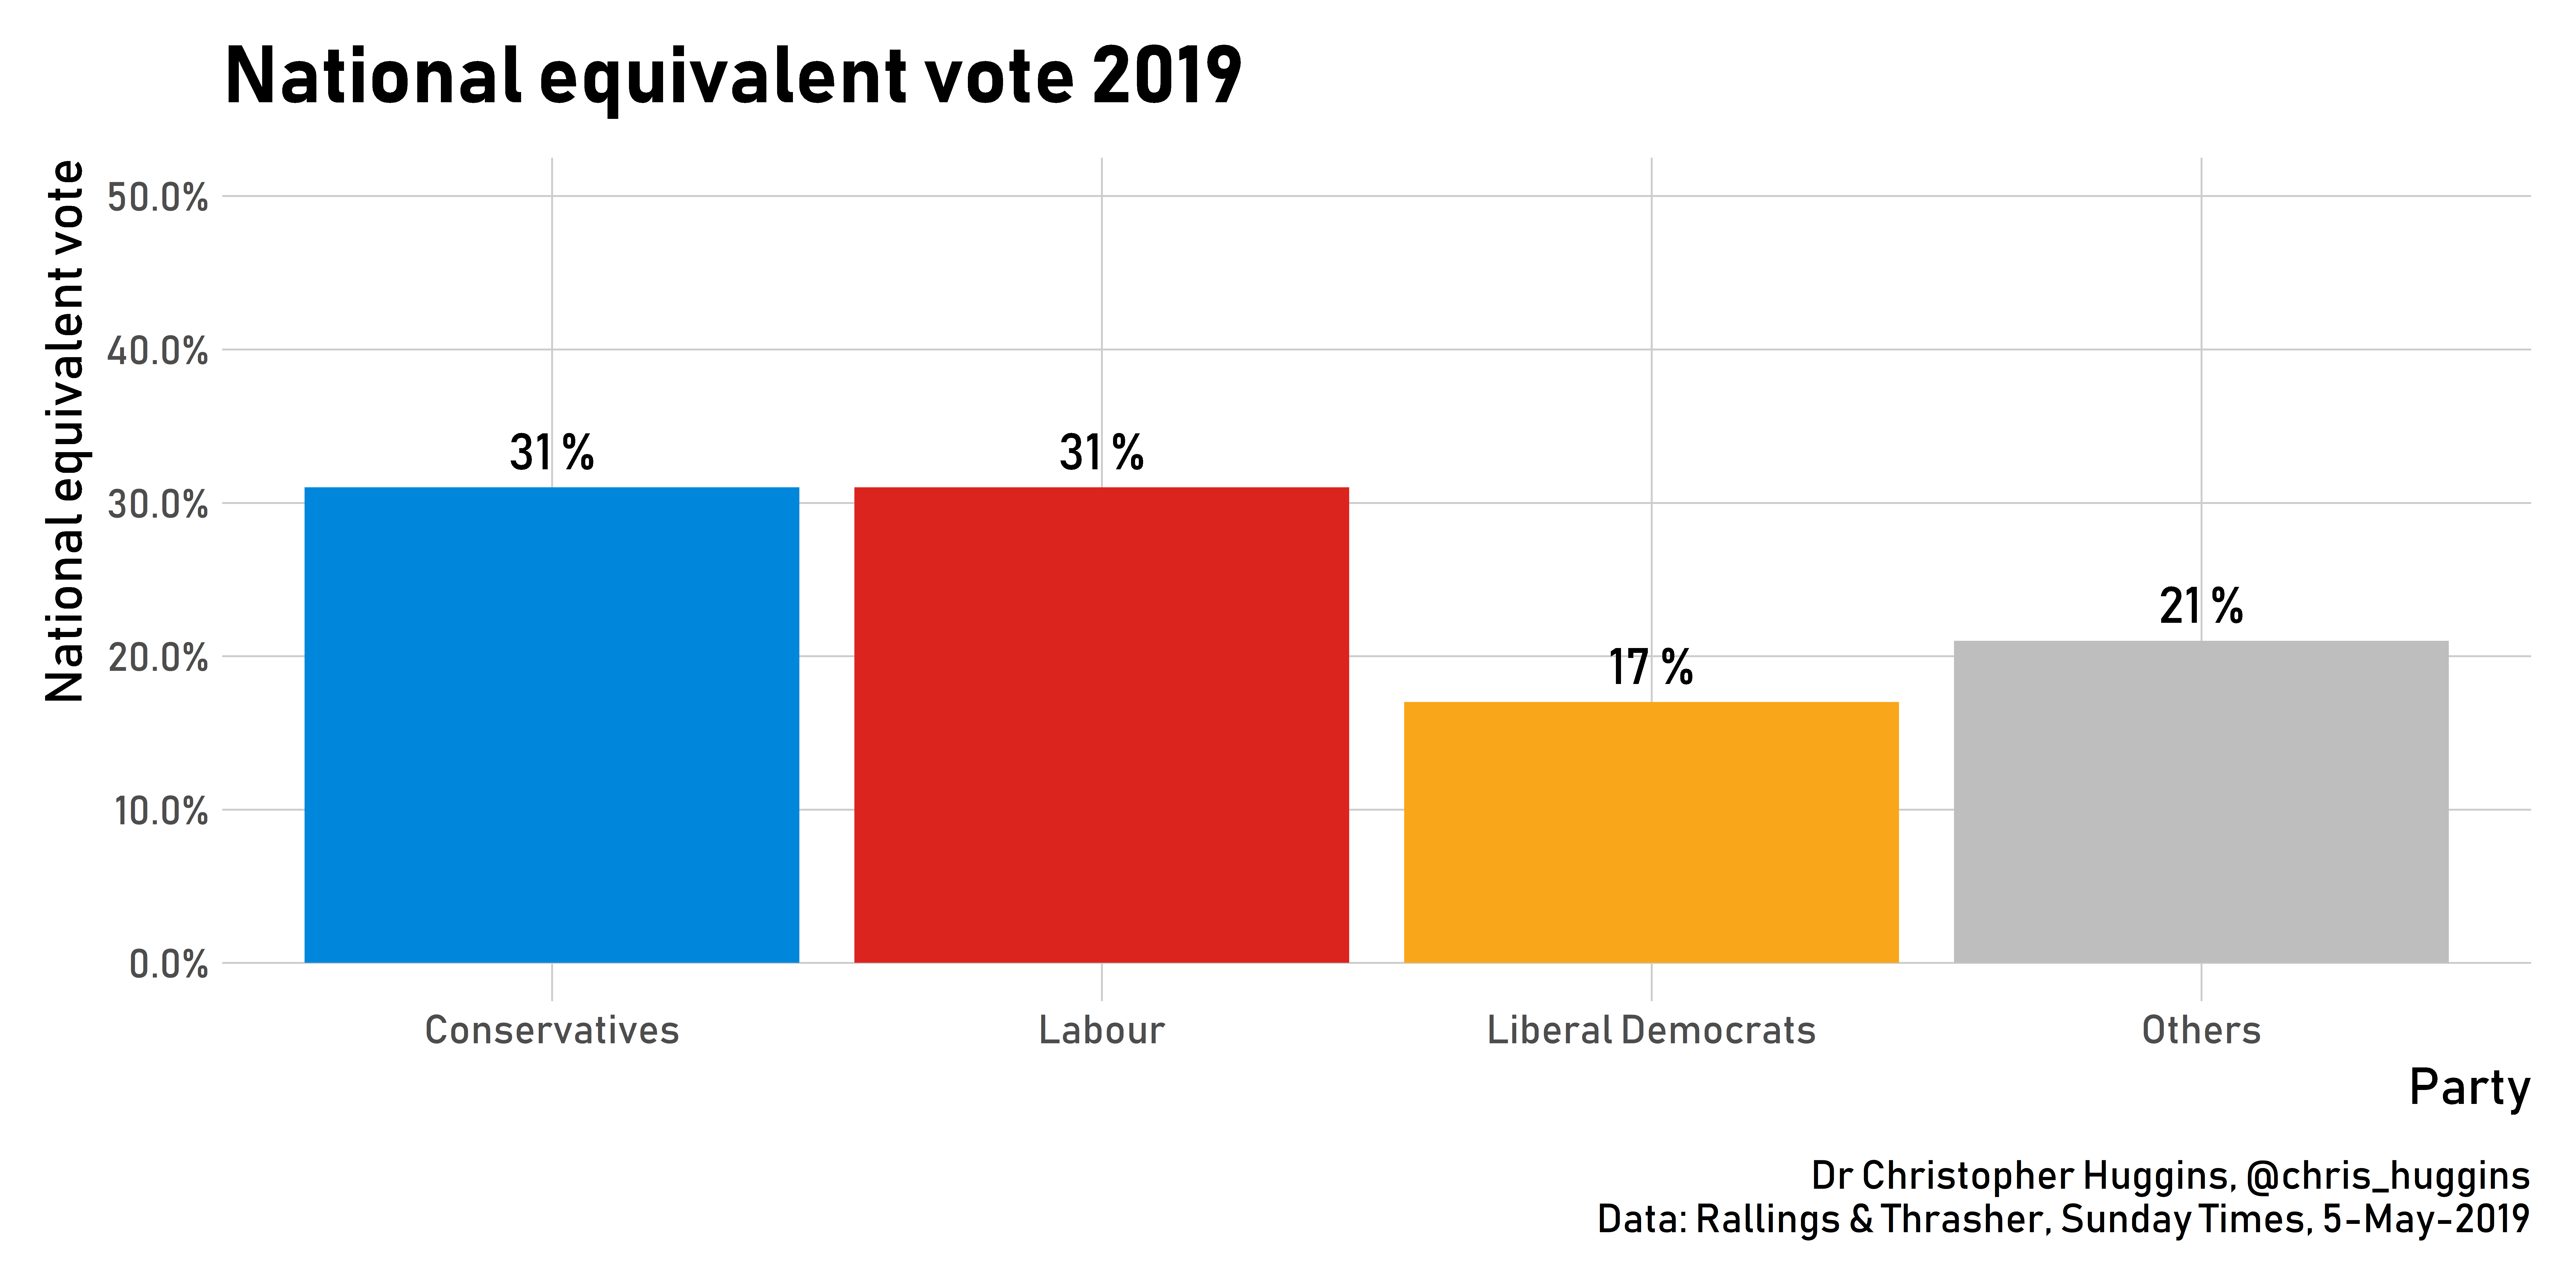
Because of this, these measures provide a much better way to assess the state of national political parties’ performance in local elections over time.
All politics is local
Eyeballing who’s won or lost seats in local elections is therefore a poor measure, and models which try to extrapolate a national vote share are perhaps a better way at trying to build a national picture. But this can only tell us so much. We should also bear in mind that despite the desire to come to national conclusions, local issues do matter in local elections. Indeed, ward-level analysis suggested the Brexit link to the results may have been overplayed in much of the coverage and that there are broader shifts in voter behaviour often determined by ‘place’ going on. And while the coverage of the results was dominated by Brexit, relatively little has been said about the ever continuing degradation of local public services administered by councils (formerly) run by the two main parties.
Overall then, we need to interpret local election results with a little more caution and nuance. Moving away from who won or lost how much would allow us to get a better idea of what’s going on, as well as encourage us to drill down further beyond basic national trends.